Analysis of Georgia’s ceramic industry and its competitive advantage
Does Georgian Ceramic Industry Have Competitive Advantage on Local And International Market Arena?
The purpose of this review is to identify the factors that provide sustainable competitive advantage to the Georgian ceramic industry with capabilities Import substitution and the potential to promote more exports in the region. The research uses Diamond Porter’s model to identify Leading the competitive industry nationwide for sustainable development and horizontal and vertical integration of the supply chain.
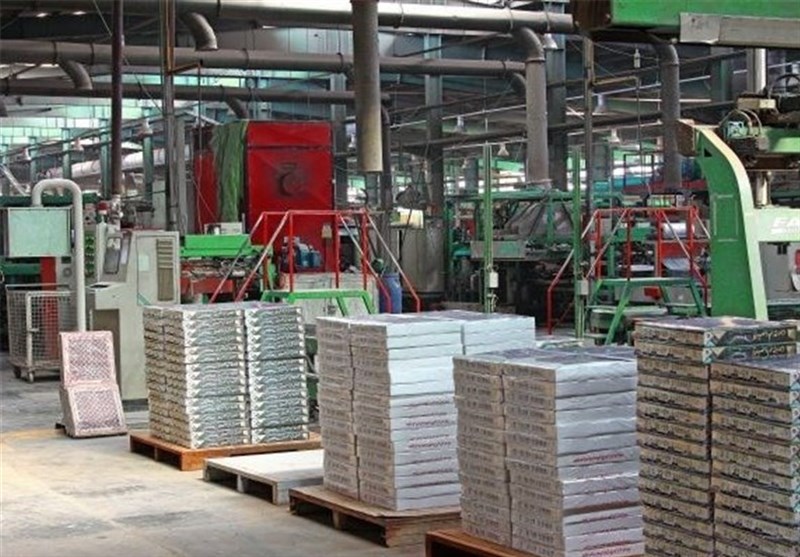
Every State’s prosperity is formed gradually, not inherited by the fortune of the history. Country’s success does not evolve out of a nation’s natural endowments, its labor pool and interest rates, or its national currency’s worth, as it is stated in the theory of classical economics.
It is crucial to underline, that country’s competitiveness and sustainability is subject to the capacity of its industry to innovate and upgrade. Local state owned and private enterprises gain advantage against the world’s top competitors due to the commercial pressure and challenge. Market players benefit from having strong domestic rivals, aggressive internal suppliers and supportive industries, challenging local customers with strong demand conditions.
The Georgian ceramic industry is presented as a source of sustainable competitive advantage to substitute imports and stimulate nationwide supply chain backward and forward integration processes. Local ceramic industry’s competitive advantage is developed and sustained through a highly integrated localized process. Diversity in national values , culture, trade balance structures, state institutions, and histories all contribute to final competitive success. It is worth to underline that there are variety of patterns that shape competitiveness in every country; no nation can or will have power and capability of competition in every single industry.
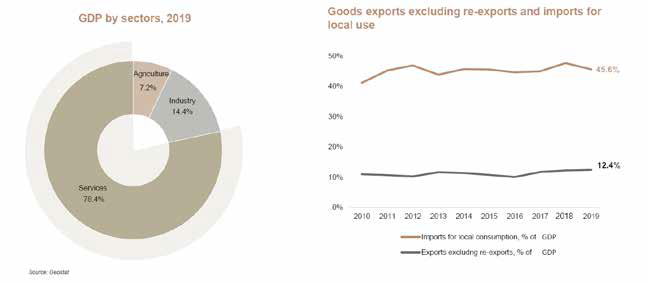
According to Geostats (2020) Georgia’s economic growth is driven by services and goods; however, exports base is exceptionally low. From the analysis of the Growth Domestic product in year 2019, it is vivid that services contribute 78.4 percent of total GDP, while Industry generates only 14.4 percent and respectively agriculture is the lowest with 7.2 percent in GDP share. At the same time, according to Chatham House (2020) total exports excluding re-exports is only 12.4 percent of GDP, while import for local consumption peeked to 45.6 percent of GDP that stipulates negative trade balance of the country. Imports are valued only for local consumption (re-exported categories are reduced by copper concentrate, cars, pharmaceuticals, and tobacco); Exports also exclude these re-export products to present accurate picture.
According to Geostats (2020) Georgia’s economic growth is driven by services and goods; however, exports base is exceptionally low. From the analysis of the Growth Domestic product in year 2019, it is vivid that services contribute 78.4 percent of total GDP, while Industry generates only 14.4 percent and respectively agriculture is the lowest with 7.2 percent in GDP share. At the same time, according to Chatham House (2020) total exports excluding re-exports is only 12.4 percent of GDP, while import for local consumption peeked to 45.6 percent of GDP that stipulates negative trade balance of the country. Imports are valued only for local consumption (re-exported categories are reduced by copper concentrate, cars, pharmaceuticals, and tobacco); Exports also exclude these re-export products to present accurate picture. Given figures are presented in chart bellow:
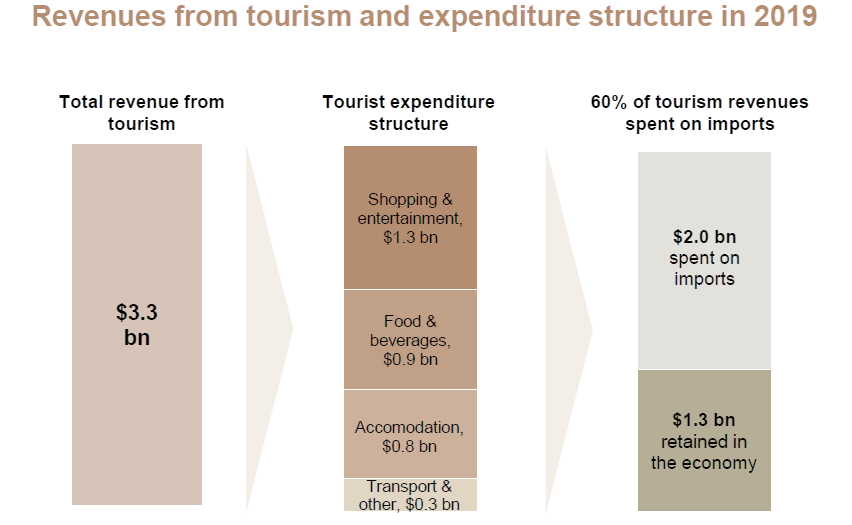
Tourist Industry Structure and Revenue Formation National Tourist agency (2020) underlines that in year 2019 total revenue from tourism industry contributed 3.3 billion USD. Structurally given amount is split between shopping and entertainment 1.3 billion USD, food and beverages 0.9 billion USD, accommodation 0.8 billion USD, transportation 0.3 billion USD. Simultaneously, research evaluated that 60 percent of total tourism revenues is spent on import to generate the value offering for customer. More specifically out of 3.3 billion USD, 2 billion is spent on imports while 1.3 billion USD is retained back in the Georgian national economy. Visualization of the information is presented in chart bellow.
Accordingly, our research is focused on Constructions and industrial materials sector and more specifically ceramic industry competitive advantage is analyzed to identify sources of sustainable development and growth if any.
Construction and Industrial Materials Industry According to TBC invest (2020) next five years, in the pipeline of construction and industrial materials direction Georgia has private and public projects with total worth of 25 billion USD. Out of which residential real estate contributes 10 billion USD, government infrastructural projects achieve 5 billion USD and hotel sector generates 1.7 billion USD.
According to Galt and Taggart (2020) last ten years Georgia faces ongoing trade deficit in construction and industrial materials. Also, in the last year of the import structure of whole industry, ceramic products generated 79 million USD imports. Detailed industry analysis is presented in chart bellow.
Ceramic Industry Structure
According to Fuchs (2005) the phrase ‘ceramics’ or ceramic products is used for inorganic materials with possibly some organic content , made up of non-metallic compounds and made permanent by a firing process. In addition to clay-based materials, today ceramics include a multitude of products with a small fraction of clay or none. Ceramics can be glazed or unglazed, porous, or vitrified. Firing of ceramic bodies induces time-temperature transformation of the constituent minerals, usually into a mixture of new minerals and glassy phases. Characteristic properties of ceramic products include high strength, wear resistance, long service life, chemical inertness and nontoxicity, resistance to heat and fire, (usually) electrical resistance and sometimes also a specific porosity. Euro Commission (2007) states that Clay raw materials are extensively distributed all over Europe including Georgia, so ceramic products like bricks which are relatively inexpensive but which incur high transport costs due to their weight are manufactured in virtually all Member States. Building traditions and heritage considerations result in different unit sizes from country to country. More specialized products which command higher prices tend to be mainly produced in a few countries, which have the necessary special raw materials and equally important – traditions of skill and expertise. Research is concerned with one part of the ceramic industry known as wall and floor tiles industry.
Ceramic wall and floor tiles are vital wall and floor covering products used in the building and housing industry, accordingly the maintenance and renovation market is of special importance to given products. Other multifunctional applications are, the use of tiles for external facades, swimming pools and public areas.
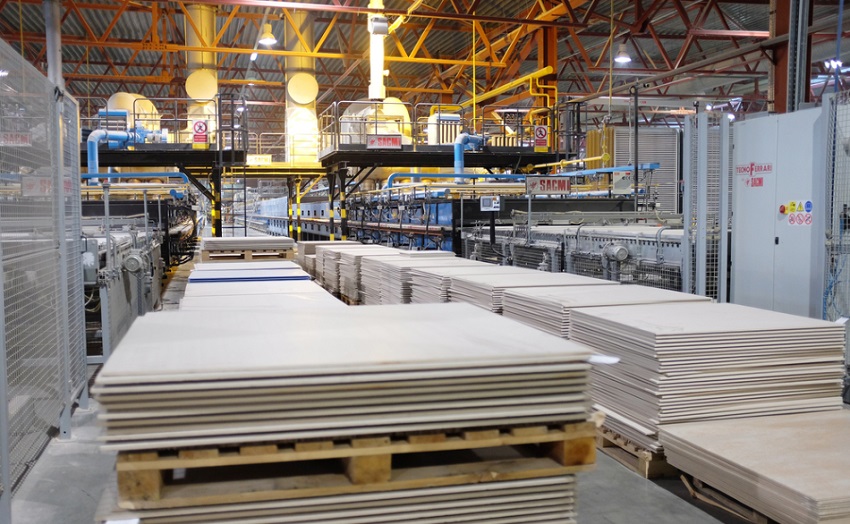
According to Navarro (1998) The wall and floor tile manufacturing process consists of a following stages: storage of raw materials, body preparation (dust pressing powder (dry or wet process) or extrusion paste), shaping, drying of the green body, glaze preparation and glazing, firing (with or without glazing), polishing, sorting and packaging.
Shreve (1945) states that Clays and kaolin are common plastic raw materials used in the manufacturing of wall and floor tiles. Chamotte, quartz, feldspars, calcium carbonate (calcite), dolomite and talc are non-plastic raw materials with different functions in the body composition for instance feldspars act as fluxing agents, while calcite enables the formation of crystalline phases. The same raw materials combined with glaze frits, metal oxides and colorants are also used for glazes. Electrolytes such as sodium silicate or diphosphate are added to reduce the energy consumption in the drying process by water reduction.

Main Findings
Georgia has a history of wall and floor tile production, during soviet planned economy Tbilisi Ceramic Combinate, Floor Tiles Tbilisi Construction Material Combinate and Chkhari Floor Tile Factory were producing the above-mentioned products. However, in early 90’s the production process stopped all over the country.
Demand Condition
Firstly, research evaluates the demand conditions within country and Caucasian region. In 2019 the ceramic tile imports to Georgia achieved about 53 million USD and Caucasian region import picked to 350 million USD. Due to real estate industry annual growth on average by 20 percent the ceramic industry has a relative growth indicator. Last ten years ceramic tile imports to Georgia is growing gradually with minor fluctuations.

residential area in Tbilisi 27 000 000 square meters, Office area in Tbilisi 892 500 square meters, commercial space in Tbilisi 887 280 square meters and storage space in Tbilisi 1 098 000 square meters. It is obvious that 90 percent of Georgian demand comes on inhouse application ceramic wall and floor tiles.
From regional perspective Russian Caucasus consumes 60 million USD tiles, Ukraine on average imports of 170 million USD worth of tiles, respectively Turkey imports 110 million USD tiles, Azerbaijan imports on average 30 million USD ceramic tiles and Armenia imports stably 7 million USD worth of ceramic tiles. Hence, total regional market fluctuates in the range of 350 million USD. Given condition gives opportunity to build factory with production capacity of 3 000 000 square meter tile production annually

Research has determined that 90% of the raw materials needed to produce floor and wall tiles are available locally in Georgia. Another important factor is the educated, skilled professional workforce and relevant technological lines to maintain the production process. Such factors do not exist in Georgia and should be created through the purchase of international licenses and professional training through foreigners. Production technology is not comprehensive and innovative, so these two factors are not lacking in international markets.
Raw material deposits should become operational and supply chain needs to be organized, because no extraction of raw materials takes place on the given stage. Also, it is worth to underline that cheep energy resources in the region support ceramic industry development in general.
Related and Supportive Industries Ceramic floor and wall tile industry is characterized with extremely law dependency on the related and supportive industries, mainly industry does not need any support from the suppliers. Occasionally based on the production peculiarities certain raw materials need to be pre-dried, for example sand may be dried using fluidized bed technology and rotary dryers may be used. Many refined ceramic raw materials are purchased from specialist suppliers – usually in a dry state. Also, it should be remarked that some synthetic materials such as silicon carbide may be manufactured by specialist suppliers but may still need to go through the comminution process. Firm Strategy, Structure, and Rivalry From competition perspective inside Georgia industry is characterized by first entry advantage because no competitor exists inside the country. However, from the regional scope one ceramic tile factory operates in Armenia and another one in Azerbaijan, however they satisfy only 4-5 percent of the regional demand. First stage strategy is to substitute imports and then develop export promotion strategy.
To sum up, Georgian ceramic tile industry has internal and regional competitive advantage, that allows future local manufacturers to substitute imports and further promote exports in the region. According to the Porter’s Dimond analysis all factors are favorable for ceramic industry development if proper government support and non-tariff barriers will be presented in future for national ceramic industry support and development.
قیمت های موجود در سایت تاریخ بروزرسانی آن ها ذکر شده و قیمت نهایی محصولات نمی باشند. لطفا جهت ثبت سفارش و استعلام قیمت بروز با کارشناسان ما در ارتباط باشید.
(035-3357)