


Every pallet of tile that leaves a factory carries a number nobody puts on the invoice: liters of water. Not glaze thickness, not firing temperature, not even the carbon figure most buyers have started tracking — water. And for procurement teams sourcing at volume for the European market, that number is quietly becoming as important as price per square meter.
Water consumption in tile production has stayed almost invisible in trade conversations for decades. Suppliers talk about PEI ratings, breaking strength, and shade variation. Almost none volunteer how many liters of water were used to make the batch sitting in the container. That’s starting to change, and buyers who understand the numbers now will have real leverage in negotiations later.
This guide breaks down exactly how much water goes into a square meter of exported tile, where in the process that water disappears, how Iran’s tile industry — one of the world’s larger exporters — fits into that picture, and what a bulk buyer should actually ask a supplier before signing a contract.
Why Water Footprint Is Suddenly a Procurement Issue
For years, sustainability conversations around ceramics focused almost entirely on energy and CO2, because firing kilns run on gas and gas is easy to measure. Water got left out of the spotlight even though it’s consumed at nearly every stage of manufacturing, from slurry preparation to glazing to final cleaning.
That’s changing for three concrete reasons.
European buyers are being asked to prove their supply chain, not just describe it. Construction product regulation in the EU increasingly leans on Environmental Product Declarations (EPDs) built to the EN 15804 standard, which requires manufacturers to report a specific metric called Water (User) Deprivation Potential — a figure that reflects not just how much water was used, but how scarce that water was where it was drawn. A tile made with the same 20 liters per square meter in a water-rich region and a drought-stressed region does not score the same.
Water scarcity is now a direct cost risk, not just an ethical one. Ceramic manufacturing depends on a stable water supply for slurry milling, spray drying, and glaze application. Regions under water stress face production slowdowns, quality inconsistency, and in some cases forced downtime — all of which eventually show up as late shipments and price volatility for the buyer on the other end of the contract.
Sustainability disclosure is moving from “nice to have” to a tender requirement. Large European distributors, retailers, and public infrastructure projects increasingly ask for LEED or BREEAM-eligible documentation, and EPDs are one of the few credentials that unlock those credits. A supplier who can’t produce one is quietly disqualifying themselves from a growing share of demand.
How Much Water Actually Goes Into One Square Meter of Tile?
Here’s the number that rarely makes it into a product catalog: research published in the International Journal of Applied Ceramic Technology puts average water consumption at roughly ۲۰ liters per square meter of manufactured tile, alongside around 32 kWh of energy per square meter. A separate life-cycle study focused on alumina-based tile preparation arrived at a similar figure, also close to 20 liters per square meter, with about 60% of that consumed during the milling stage alone.
That 20-liter figure is an industry average, not a fixed law. Actual consumption swings meaningfully depending on the production route a factory uses, its equipment age, and whether it recycles process water internally.
Where the Water Actually Goes
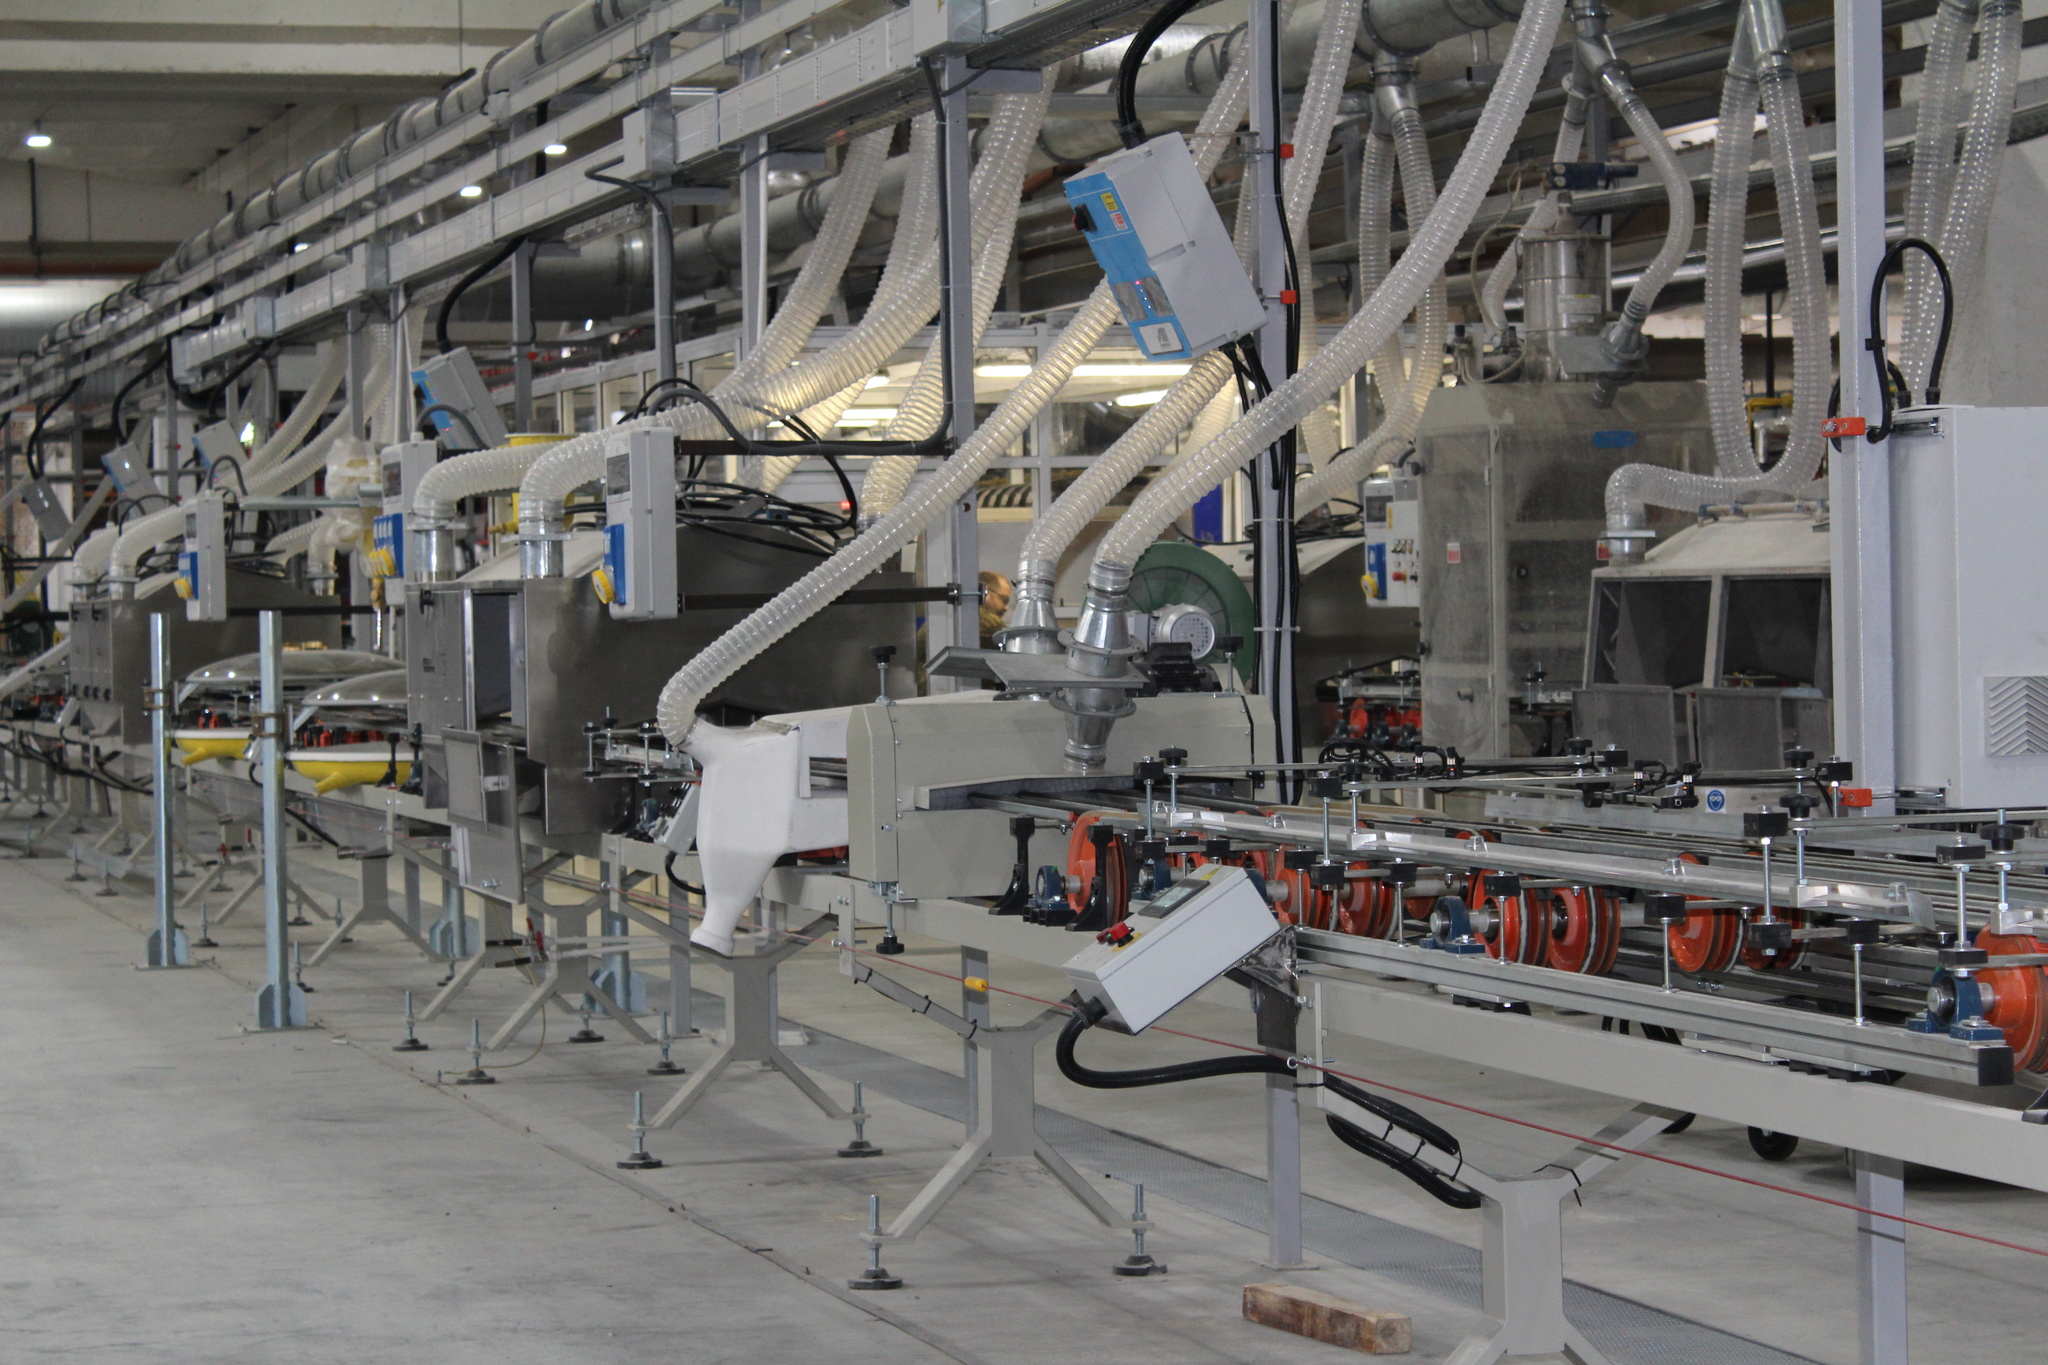
Water isn’t consumed in one single step — it’s spread across the entire manufacturing chain:
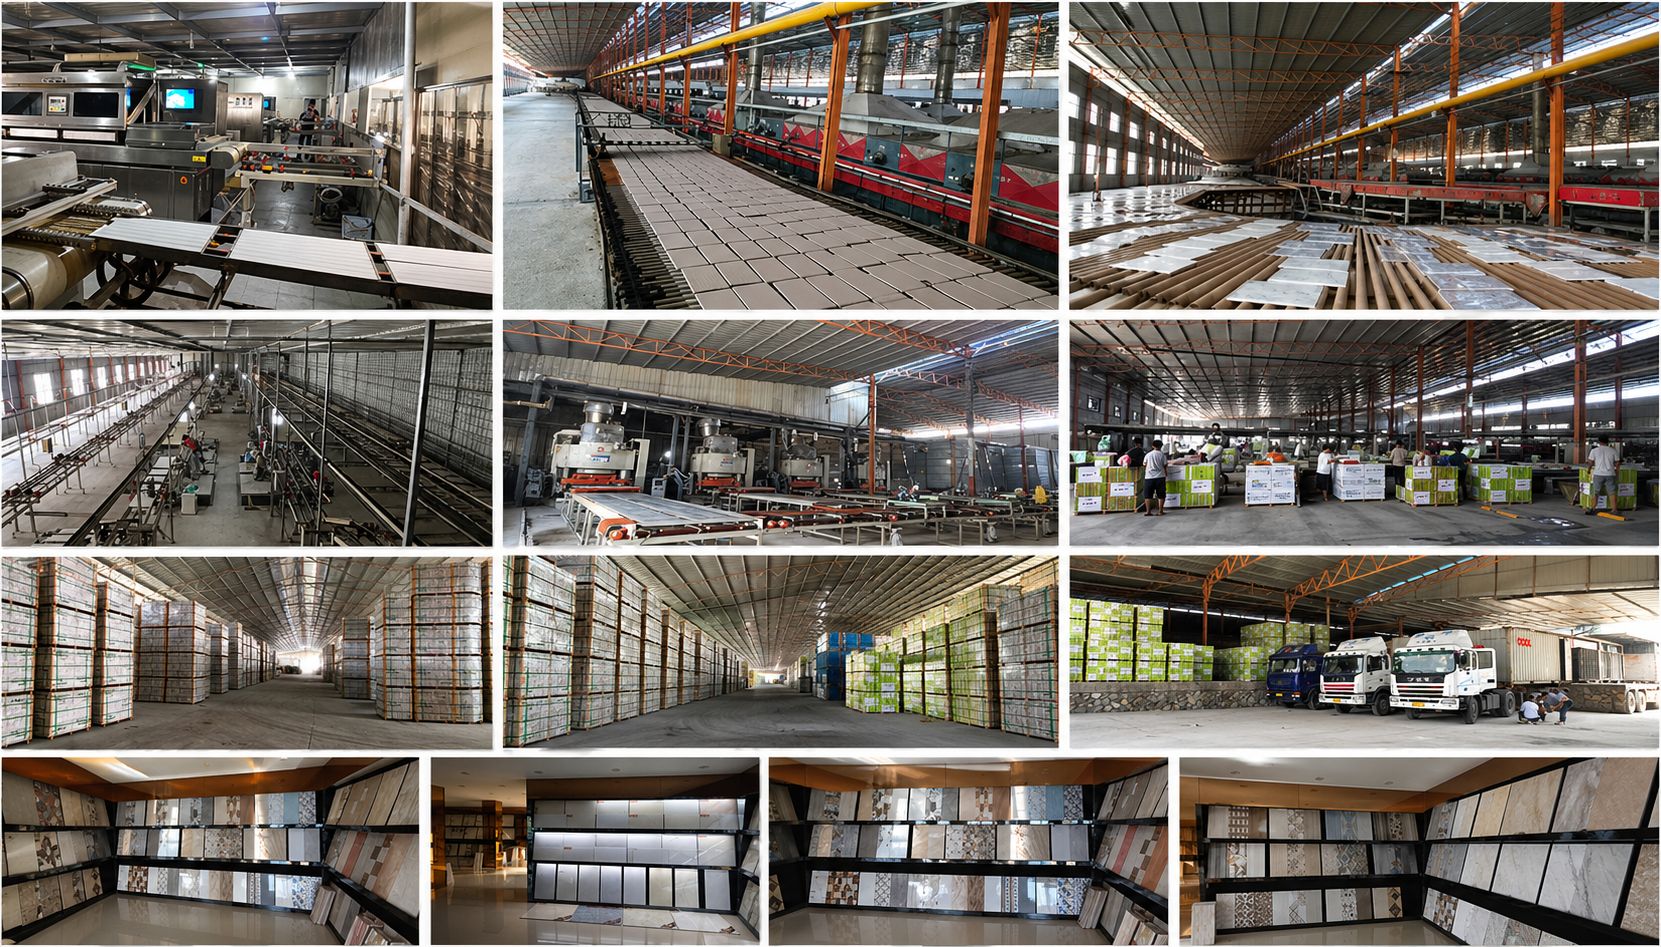
- Raw material milling and slurry preparation — the single largest share, since clay, feldspar, and other minerals need to be wet-milled into a workable suspension before shaping.
- Spray drying — the slurry is converted into a granulate for pressing; this stage also carries a heavy share of the energy footprint, since drying accounts for roughly a third of total thermal energy use in the process.
- Glazing and decoration — glaze suspensions and digital printing lines both use water as a carrier medium.
- Cooling and equipment cleaning — kilns, presses, and glazing lines require water for temperature control and routine cleaning between production runs.
Wet Route vs. Dry Route: The Difference That Actually Matters
Not every factory prepares raw materials the same way, and this single choice explains most of the gap between water-efficient and water-heavy producers.
| Production Route | How It Works | Relative Water Use | Common In |
| Wet route (wet milling) | Raw materials are ground in water to form a slurry, then spray-dried | Higher — most of the ~20L/m² average comes from this route | Larger-format porcelain, premium finishes |
| Dry route (dry milling) | Raw materials are ground dry and moisture is added only at the pressing stage | Lower — can cut water use significantly compared to wet milling | Facilities investing in newer, resource-efficient lines |
Buyers comparing two seemingly identical porcelain tiles from different factories are often, without realizing it, comparing a wet-route product to a dry-route product — with a real difference in water footprint behind the price tag.
Global Production Context: Why the Numbers Are Getting Louder
Ceramic tile is not a niche building material. Global production reached over 18 billion square meters in a recent year, with Asia responsible for roughly three-quarters of global output. Spain and Italy together account for around 70% of European Union tile production, and it’s largely their EPD disclosure practices — driven by EU construction product rules — that are setting the documentation standard the rest of the exporting world is now being measured against.
That matters for buyers sourcing outside the EU: the bar for “acceptable proof” is increasingly set by European producers, whether or not the exporter selling to you is one of them.
Iran’s Tile Industry: Scale, Export Volume, and the Water Question
Iran is one of the more overlooked players in the global tile trade, and it’s a useful case study precisely because its water story is more complicated than most exporters admit.
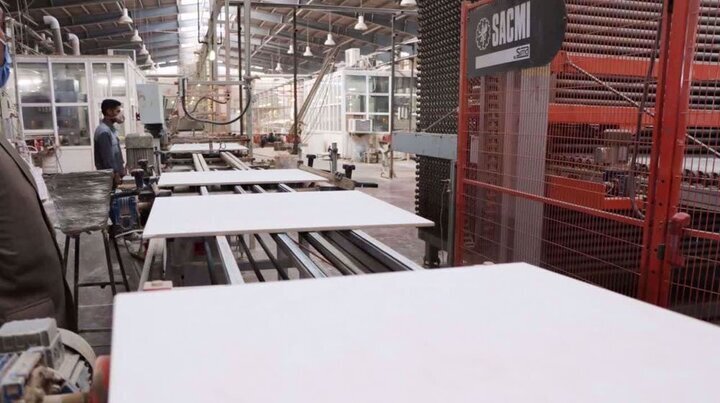
Scale. Iran’s ceramic tile production capacity sits at roughly 700 million square meters a year, with actual output closer to 400 million square meters — meaning a large share of installed capacity runs below capacity in a given year. Yazd province is the industry’s clear center of gravity, hosting the largest concentration of production units in the country and often lending its name — “Yazd tile” — to Iranian ceramics sold abroad. Isfahan and Khorasan Razavi are the next largest production hubs.
Exports. In a recent year, Iran exported around 40% of its total production to more than 50 countries, positioning it as a genuine mid-tier global supplier rather than a purely domestic industry.
The water tension. Here’s what makes Iran’s case genuinely relevant to the sustainability angle: much of that production is concentrated in a province that sits in one of the country’s more water-stressed regions. Academic research on the Iranian ceramic sector has specifically flagged water recycling as an unresolved operational challenge for wet-route manufacturers in Yazd, noting that saving and recycling water in spray-drying operations is one of the more serious levers available to the industry, both for easing regional water pressure and for improving long-term production stability.
For a European buyer, that combination — meaningful export volume, wet-route-heavy production, and location in a water-stressed region — is exactly the profile that should prompt a direct question at the sourcing stage: how is this specific factory managing its process water, and can they show it?
This isn’t a reason to avoid Iranian tile as a category. It’s a reason to ask better questions of any individual factory, regardless of country, and to treat “made in a water-stressed region” as a due-diligence flag rather than a disqualifier.
What Separates a Water-Efficient Manufacturer From a Water-Heavy One
Not all factories using the same raw materials end up with the same footprint. In practice, the gap comes down to a handful of operational choices:
- Closed-loop water recycling. Factories that recirculate process water from milling, glazing, and cleaning back into production can cut fresh-water intake substantially compared to single-pass systems.
- Dry or semi-dry milling technology. As shown above, this alone removes much of the water demand tied to slurry preparation.
- Modern spray-drying equipment. Older spray dryers tend to run less efficiently, requiring more water and more energy per unit of output.
- On-site wastewater treatment. Facilities that treat and reuse cleaning and cooling water reduce both intake and discharge — a factor increasingly checked in EPD documentation.
- Regional water stress awareness. Some manufacturers actively site or upgrade facilities specifically to reduce dependency on stressed local aquifers or municipal supply.
None of these are visible from a product photo or a spec sheet. They only become visible when a buyer asks for documentation.
How to Verify a Supplier’s Water Footprint Claims
Marketing language around “eco-friendly” or “sustainable” tile production is easy to print and hard to prove. Here’s what actually counts as evidence, in rough order of reliability:
- A third-party-verified EPD (Environmental Product Declaration), built to EN 15804 or ISO 14025, listing Water (User) Deprivation Potential and total freshwater use per functional unit.
- ISO 14046-based water footprint assessments, which quantify water use across the product’s life cycle rather than relying on self-reported averages.
- ISO 14001 environmental management certification, which doesn’t guarantee low water use on its own but indicates a factory has systems in place to track and manage resource consumption.
- Documented recycling rates for process water, ideally expressed as a percentage of total water reused rather than a vague claim.
- Site audit reports, particularly for factories in regions with known water stress, confirming actual practice matches paperwork.
A supplier who can produce an EPD without hesitation is telling you something important about how their operation is run — not just about water, but about overall production discipline.
A Practical Checklist for Bulk Buyers
Before finalizing a large-volume tile order, it’s worth running through a short set of questions with the exporter:
- Does this specific product line have a current, third-party-verified EPD?
- What is the reported water footprint per square meter, and how does it compare to the ~20 L/m² industry average?
- Is the factory using a wet or dry milling route for this product?
- What percentage of process water is recycled on-site?
- Is the production facility located in a region classified as water-stressed?
- Has the factory faced any production disruptions tied to water availability in the past three years?
None of these questions will slow down a serious supplier. They tend to reveal, quickly, which factories have actually invested in resource efficiency and which are simply hoping nobody asks.
Conclusion
Water consumption in tile production has been the quiet variable in an industry that talks constantly about durability, design, and price — but rarely about the resource it depends on most. The industry average sits around 20 liters per square meter, but the real number for any given shipment depends heavily on milling route, equipment age, and recycling practices at the specific factory that made it.
For buyers sourcing at volume, especially into the European market where EPD documentation is fast becoming a baseline expectation rather than a bonus, water footprint is no longer a side detail. It’s a due-diligence item that belongs in the same conversation as price, lead time, and quality control.
The next time a quote comes in, it’s worth asking the supplier for one more document alongside the technical data sheet: proof of water use. The factories that can hand it over without delay are usually the ones worth building a long-term relationship with.

نظرات ۰